hughjonesd.github.io
Introduction to Huxtable
English-language posts that have an #RStats #QuartoPub DuckDB #RLadies or #PyLadies hashtag or contain DuckDB BlueskyFeedCreator.com
Feed on Bluesky


Dariia Mykhailyshyna@dariia.bsky.social
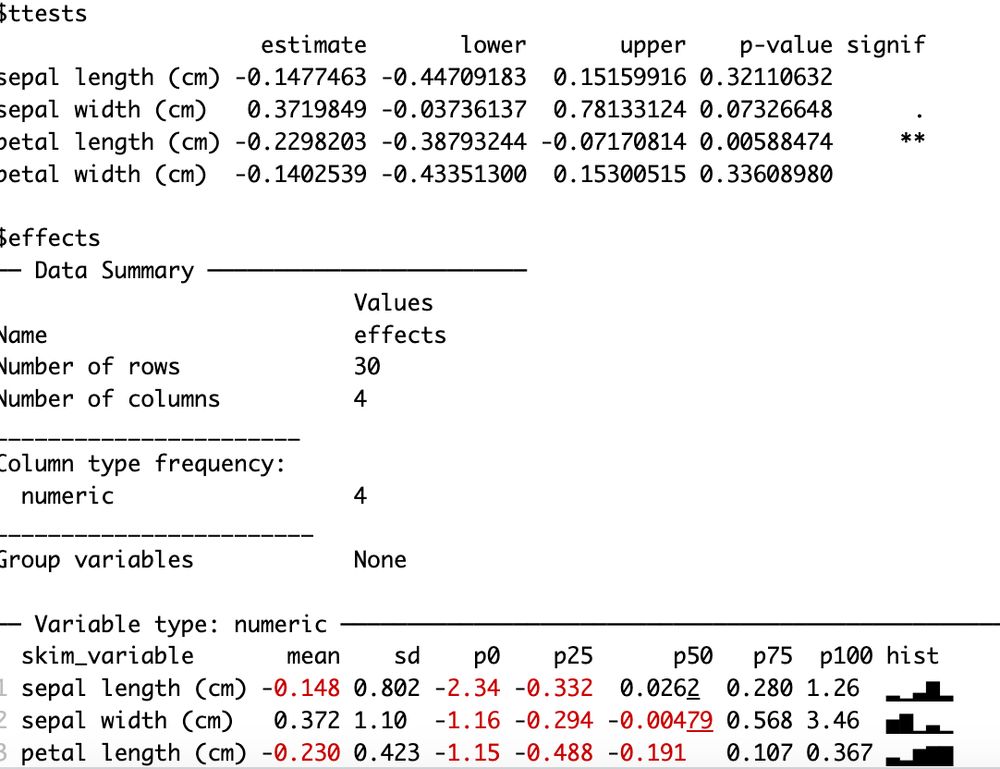
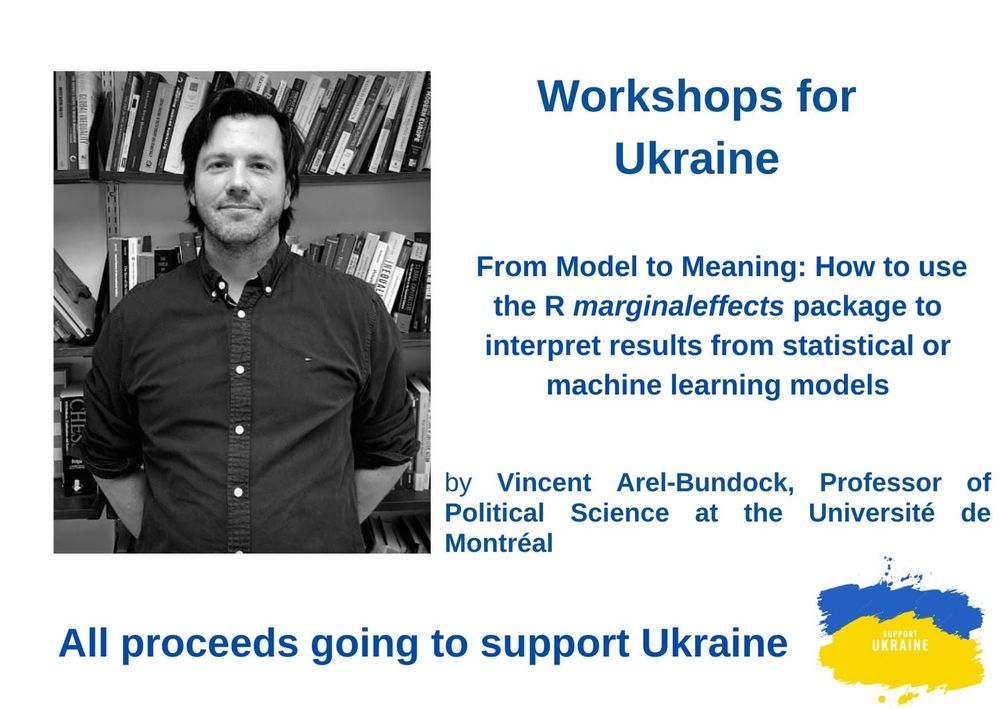
❗️Our next workshop will be on August 14, 6 pm CEST, on marginaleffects package by @vincentab.bsky.social ! Register or sponsor a student by donating to support Ukraine! Details: bit.ly/3wBeY4S Please share! #AcademicSky #EconSky #RStats


Umair Durrani@transport-talk.bsky.social
{chores} is awesome! Here I'm generating a _brand.yml in RStudio #RStats


hughjonesd.github.io
Introduction to Huxtable


Emil Hvitfeldt@emilhvitfeldt.bsky.social
some light teasing for an upcoming quarto revealjs plugin I have been working on


Posit@posit.co
Ever wonder how an actuary becomes a data science educator? 🤔 Tune into the latest episode of The Test Set with @minecr.bsky.social. We discuss everything from her #RStats journey to her use of LLMs to give students feedback on their code. Listen: thetestset.co, on Spotify, or Apple Podcasts


youtu.be
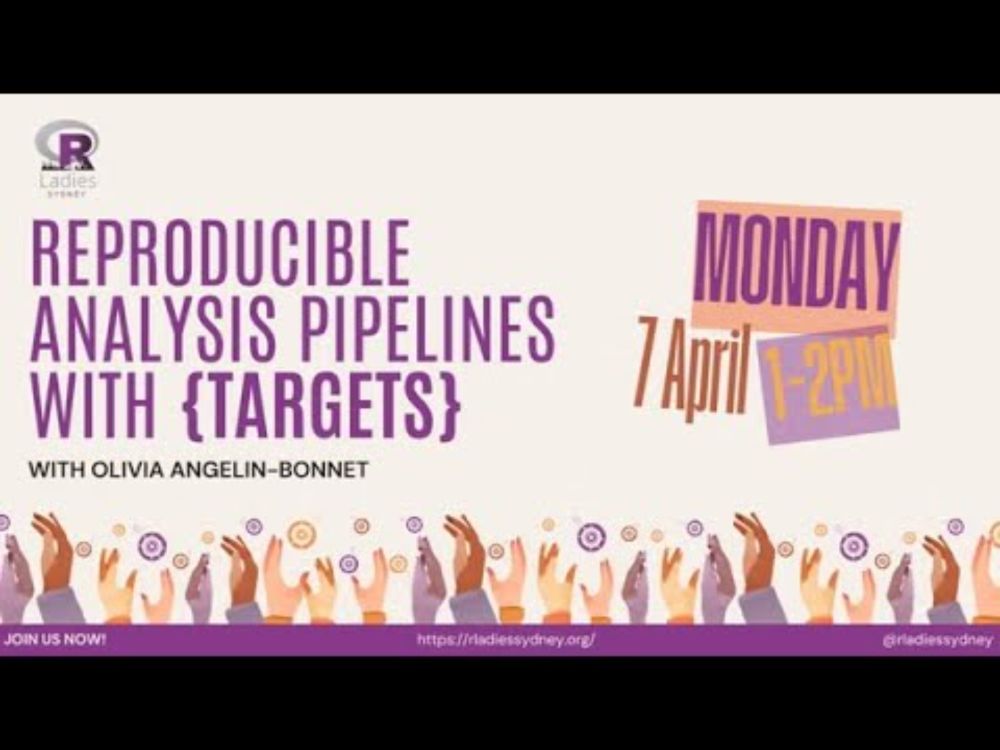
Reproducible analysis pipelines with {targets}
YouTube video by RLadies Sydney

R-Ladies Melbourne@rladiesmelb.bsky.social
Tired of rerunning everything every time you change a line of code? 😩 The {targets} package automates your #Rstats workflow—only running what’s needed, tracking dependencies, keeping your analysis reproducible & efficient. ⏩ books.ropensci.org/targets/ #RStats #ReproducibleResearch #DataPipelines
books.ropensci.org

books.ropensci.org
The {targets} R package user manual
Will Landau

Nic Crane@niccrane.bsky.social
Thinking about building a Big Data in R training course - could be self-paced or live. If you've used Arrow (or want to), can you spare 3 mins for a quick survey? Your input will shape what I make. forms.gle/H68h7NSoAfXX... #rstats
forms.gle