1. Bluesky Feeds /
  2. Sharon Machlis /
  3. Fave data hashtags

Posts that have an #RStats #QuartoPub DuckDB #RLadies or #PyLadies hashtag or contain DuckDB

Feed on Bluesky
Feeds Stats

  • 💙 Liked by 2 users
  • 📅 Updated 9 months ago
  • ⚙️ Provider skyfeed.me

Fave data hashtags Likes over time

Like count prediction
The feed Fave data hashtags has not gained any likes in the last month.

Feed Preview for Fave data hashtags

Harry Vangberg
@harry.vangberg.name
3 minutes ago
We have errors, console outputs and ggplot. Getting ggplots printed correctly was surprisingly difficult – the logic of R's top-level printing is … finicky: yihui.org/en/2017/06/t... #rstats
0
0
0
Big Book of R
@bigbookofr.com
32 minutes ago
Hierarchical Compartmental Reserving Models by Markus Gesmann and Jake Morris #RStats bigbookofr.com/chapters/f…
0
0
0
T. @ Techtonique
@teeeeeeeee.bsky.social
38 minutes ago
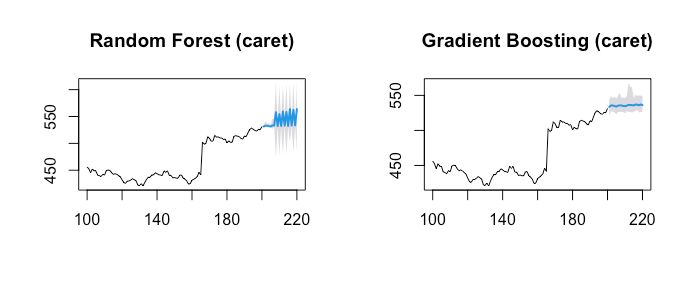
Beyond ARMA-GARCH: leveraging model-agnostic Machine Learning and conformal prediction for nonparametric probabilistic stock forecasting (ML-ARCH) thierrymoudiki.github.io/… #Techtonique #DataScience #Python #rstats #MachineLearning
Blog post image
0
0
1
T. @ Techtonique
@teeeeeeeee.bsky.social
38 minutes ago
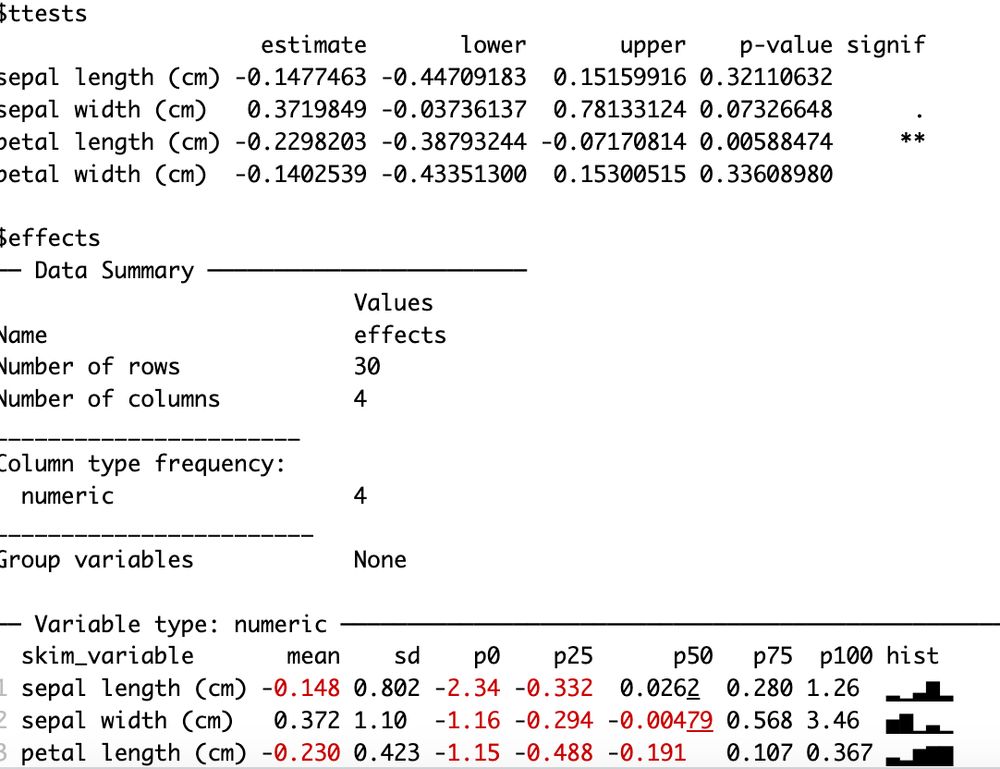
Blog post image
0
0
1
PyData Paris
@pydataparis.bsky.social
about 2 hours ago
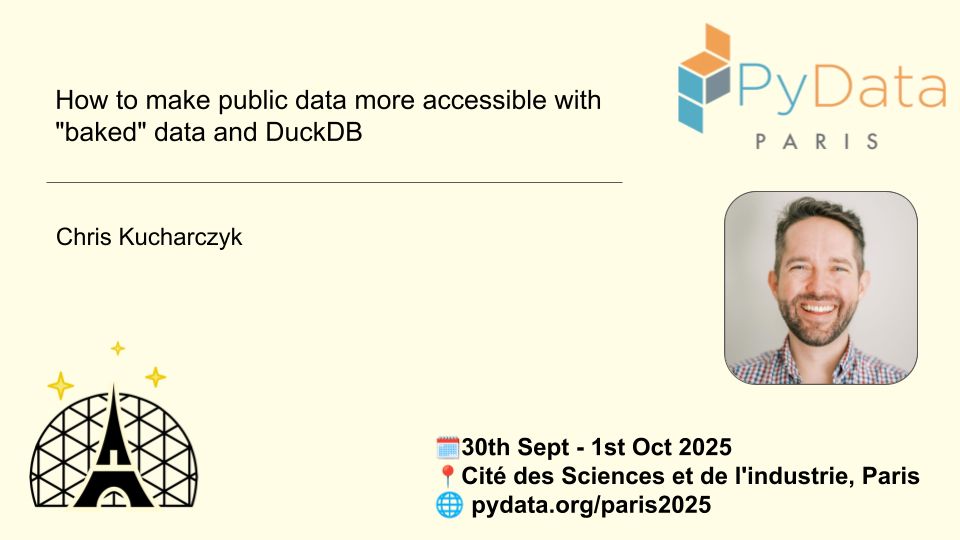
📢 Talk Announcement "How to make public data more accessible with "baked" data and DuckDB", by Chris Kucharczyk. 📜 Talk info: pretalx.com/pydata-paris-… 📅 Schedule: pydata.org/paris2025/schedule 🎟 Tickets: pydata.org/paris2025/tickets
0
0
1
Aki Ariga
@chezo.uno
about 4 hours ago
既存実装がpandasの時に、SonnetにDuckDBで再実装してっていうとスッとやってくれるのがとても助かる
0
0
0
Aki Ariga
@chezo.uno
about 4 hours ago
クソデカcsv.gzはDuckDBでparquetに変換して処理するのが一番いいな。pandas直よりメモリがグッと抑えられる。空から降ってくるmsgpackも直ちにparquetにしてしまうのは良さそう
1
0
2
Big Book of R
@bigbookofr.com
about 4 hours ago
Biostatistics for Biomedical Research by Frank E Harrell Jr #RStats bigbookofr.com/chapters/l…
0
0
0
Umair Durrani
@transport-talk.bsky.social
about 6 hours ago
#rstats folks, what do you think of the idea of a package that generates _brand.yml, color palettes, ggplot2 color/fill scales, themes, and quarto based website skeleton, all created with a user prompt (optionally image uploads)? The goal is to provide consistent branding in your projects.

{chores} is awesome! Here I'm generating a _brand.yml in RStudio #RStats

Video thumbnail
Play button
0
1
6
WOMBAT 2025
@wombat.numbat.space
about 6 hours ago
Making effective scrollytelling visualisations is hard, but @jamesgoldie.dev 's Closeread makes it so much easier. Come learn about Closeread's design decisions and what's coming next for this great tool. wombat2025.numbat.space/p…. #RStats #Python #BusinessAnalytics #DataViz
WOMBAT 2025 - Invited talk

James Goldie - Closing the scrollytelling gap with Closeread

29-30 September 2025, Naarm/Melbourne
womabt2025.numbat.space
0
2
3
Sharon Machlis
@smachlis.bsky.social
about 6 hours ago
The {huxtable} #RStats 📦 is for creating text tables. Features include: “* Export to LaTeX, HTML, Microsoft Word, Microsoft Excel, Microsoft Powerpoint, RTF and Markdown * Easy integration with knitr and rmarkdown documents” By David Hugh-Jones. On CRAN. hughjonesd.github.io/huxt….

hughjonesd.github.io

Introduction to Huxtable

0
5
12
We Are R-Ladies
@weare.rladies.org
about 7 hours ago
OK @emilhvitfeldt.bsky.social you are a day ahead of yourself. Things that make #rstats feel magic is my rocur theme for TOMORROW. But this is definitely magic: drag and drop to move and resize images in revealjs slides- you are a wizard!!

some light teasing for an upcoming quarto revealjs plugin I have been working on

Video thumbnail
Play button
1
2
13
Big Book of R
@bigbookofr.com
about 8 hours ago
Data Wrangling Essentials by Mark Banghart #RStats bigbookofr.com/chapters/g…
0
0
0
Nur Shahir, PhD
@gigiomics.bsky.social
about 8 hours ago
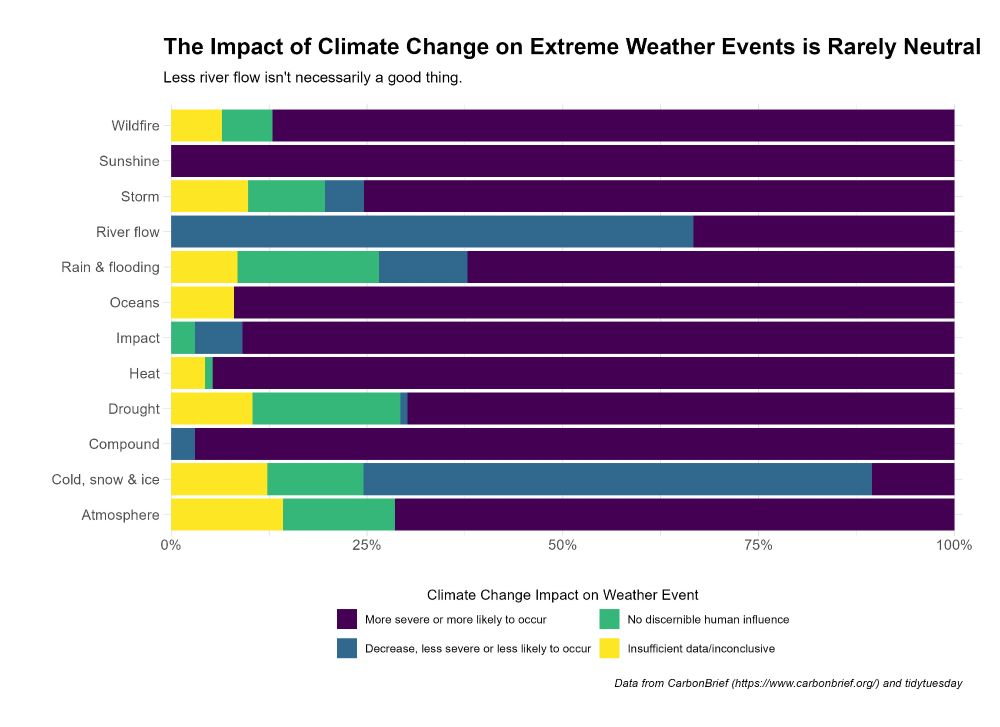
Oh hey, it's tidy tuesday (also known as I am procrastinating on writing yet another cover letter), but this week is on EXTREME WEATHER ATTRIBUTION STUDIES Code: github.com/nmshahir/tid... #RStats #TidyTuesday #Tidyverse #DataBS #Data #DataViz #r4ds
A horizontal stacked percentage barplot looking at the breakdown of the impact of Climate Change on various types of Extreme Weather Events such as Wildfires, Drought, Atmosphere to name a few. The take away point is that from studies reviewed, climate change does play a role in the severity of a weather event. Both increased severity as well as decreased severity.
2
3
10
WOMBAT 2025
@wombat.numbat.space
about 9 hours ago
In this tutorial, you'll learn how use #QuartoDev top write reproducible reports, journal articles and presentations. Also, learn how to manage bibliography automatically, create equations and render to multiple formats with #RStats and/or #Python! More info: wombat2025.numbat.space/p….
WOMBAT 2025 - Tutorial

Jayani Lakshika and Krisanat Anukarnsakulchularp - Reproducible Reporting and Research with Quarto

29-30 September 2025, Naarm/Melbourne
womabt2025.numbat.space
0
1
5
R-Ladies Melbourne
@rladiesmelb.bsky.social
about 10 hours ago
Tired of rerunning everything every time you change a line of code? 😩 The {targets} package automates your #Rstats workflow—only running what’s needed, tracking dependencies, keeping your analysis reproducible & efficient. ⏩ books.ropensci.org/targets/ #RStats #ReproducibleResearch #DataPipelines

books.ropensci.org

The {targets} R package user manual

Will Landau

0
2
5
RladiesUrmia
@rladiesurmia.bsky.social
about 10 hours ago
#ترفند جدول خوشگل تو یه خط! توی rmarkdown! میتونی هر جدول و با یه خط کد مرتب و زیبا کنی. کافیه از تابع kable تو پکیج knitr استفاده کنی. library(knitr) df=head(mtcars) kable(df) خروجی یه جدول خوانا و شکیل که مستقیم تو گزارش یا html نمایش داده میشه. [email protected] #R #RLadies
0
0
0
Kyle Walker
@kylewalker.bsky.social
about 11 hours ago
Using drive-time isochrones on-click as a "cookie cutter" on an interactive map? Why not! (And it's all done with R code) Learn how to use TurfJS in #rstats here: walker-data.com/mapgl/articl...
Video thumbnail
Play button
2
3
16