1. Bluesky Feeds /
  2. Bossett /
  3. Science

The Science Feed. A curated feed from Bluesky professional scientists, science communicators, and science/nature photographer/artists. See https://l.bossett.io/vkeNf for more information! 🧪

Feed on Bluesky

Feeds Stats

  • 💙 Liked by 28,378 users
  • 📅 Updated over 1 year ago
  • ⚙️ Provider bs.bossett.io
  • 📈 In the last 30 days, there were 9 posts about this feed. These posts got a total of 26 likes and had 2 reposts.

Science Likes over time

Like count prediction
The feed Science gains approximately 4 likes per day.

Feed Preview for Science

Dani cRabaiotti 🦀
@danirabaiotti.bsky.social
over 1 year ago
Welcome to the Science feed! Please read our FAQs for instructions for how to be added as a contributor: bossett.io/science-feed/ Mod introductory posts linked below⬇️ Use the test tube emoji on posts you want to appear in the feed🧪 Please like the feed and make sure you follow our feed rules:
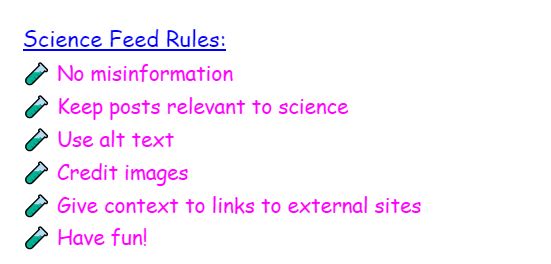
Science Feed Rules:
🧪 No misinformation
🧪 Keep posts relevant to science
🧪 Use alt text
🧪 Credit images
🧪 Give context to links to external sites
🧪 Have fun!
764
1920
27923
Shicheng Guo
@shihcheng.bsky.social
4 minutes ago
Study on 65+ hospitalized patients: Early stopping of antipsychotics lowers adverse events than continuing use post-discharge. PMID:40366701, JAMA Psychiatry 2025, @JAMAPsych doi.org/10.1001/jamapsych… #Medsky #Pharmsky #RNA #ASHG #ESHG 🧪

doi.org

https://doi.org/10.1001/jamapsychiatry.2025.0702

No description available

0
0
0
David Toews
@davetoews.bsky.social
4 minutes ago
Here’s an awkward red-faced warbler from this morning in New Mexico … to get eyeballs. The band on its leg was provided by the USGS Bird Banding Lab. It’s a thankless task, but they support permitting, band supply, data curation etc for TONS of researchers. They do such good, efficient work and … 🦉🧪
1
0
4
Princess Vimentin PhD | Cancer Biologist
@princess-vimentin.bsky.social
about 1 hour ago
🧪A very good reason why access to Covid vaccines should be preserved. Patients can develop complications following an infection. My cousin in India died of kidney failure after he got Covid.

It has been a public health failure that the public does not realize how much organ damage COVID infection can cause to things that aren’t your lungs (or throat or nose or taste buds)

2
7
29
ARC Centre of Excellence for Engineered Quantum Systems EQUS
@equscoe.bsky.social
about 1 hour ago
We are delighted to bring you Nobel Physics Prize Laureate Prof. Donna Strickland with a public lecture and fireside chat next month in Meanjin/Brisbane. ⚛️🧪 📅 Monday, 14 July 🕕 6PM 📍 State Library of Queensland + livestream 🎟️ www.quantum2025.org.au/qu….
1
0
2
David Blanchflower BSc
@davidbflower.bsky.social
about 1 hour ago
It's 2.55am. My sky is one big cloud. No chance (again) capturing Venus. Perhaps another morning. Have a good night and morning everyone. 🔭 🧪 #astrophotography
0
1
15
Nature Portfolio
@natureportfolio.nature.com
about 2 hours ago
Nature reports on how live-animal markets are a natural laboratory for viruses to evolve and spark deadly outbreaks, and how scientists lack support to study the risks these markets pose. #medsky 🧪
Exclusive: Inside the thriving wild-animal markets that could start the next pandemic

go.nature.com

Exclusive: Inside the thriving wild-animal markets that could start the next pandemic

Live-animal markets are a natural laboratory for viruses to evolve and spark deadly outbreaks, yet scientists lack support to study the risks they pose.

0
8
15
Shicheng Guo
@shihcheng.bsky.social
about 3 hours ago
Pathological BMP signaling via Grem1 in mice and humans disrupts epithelial-stromal crosstalk, forming ectopic crypts and a wnt-dependent stem cell niche. PMID:40467544, Nat Commun 2025, @NatureComms doi.org/10.1038/s41467-02… #Medsky #Pharmsky #RNA #ASHG #ESHG 🧪
Epithelial GREMLIN1 disrupts intestinal epithelial-mesenchymal crosstalk to induce a wnt-dependent ectopic stem cell niche through stromal remodelling | Nature Communications

doi.org

Epithelial GREMLIN1 disrupts intestinal epithelial-mesenchymal crosstalk to induce a wnt-dependent ectopic stem cell niche through stromal remodelling | Nature Communications

In homeostasis, counterbalanced morphogen signalling gradients along the vertical axis of the intestinal mucosa regulate the fate and function of epithelial and stromal cell compartments. Here, we use a disease-positioned mouse and human tissue to explore the consequences of pathological BMP signalling dysregulation on epithelial-mesenchymal interaction. Aberrant pan-epithelial expression of the secreted BMP antagonist Grem1 results in ectopic crypt formation, with lineage tracing demonstrating the presence of Lgr5(−) stem/progenitor cells. Isolated epithelial cell Grem1 expression has no effect on individual cell fate, indicating an intercompartmental impact of mucosal-wide BMP antagonism. Treatment with an anti-Grem1 antibody abrogates the polyposis phenotype, and triangulation of specific pathway inhibitors defines a pathological sequence of events, with Wnt-ligand-dependent ectopic stem cell niches forming through stromal remodelling following BMP disruption. These data support an

0
0
6
Dr. Jessica Ball 🍪
@tuffcookie.bsky.social
about 3 hours ago
If anyone wants to hear me and my observatory's monitoring chief talk California volcanoes, this week's NSPR Blue Dot podcast is out! 🧪⚒️🌋 Blue Dot: The Golden State's volcanic legacy: The USGS California Volcano Observatory | NSPR share.google/mko4KMElJXsU...
Blue Dot: The golden state's volcanic legacy: The USGS California Volcano Observatory

share.google

Blue Dot: The golden state's volcanic legacy: The USGS California Volcano Observatory

Host Dave Schlom discusses one of his favorite topics, California's volcanoes, with two United States Geological Survey staff members from the USGS California Volcano Observatory based at Moffett Fiel...

2
9
30
Mineral Matters
@mineralmatters.bsky.social
about 3 hours ago
Mineral Matters # 725 - Another Hidden Collection Addition #mineralmatters #minerals 🧪 open.substack.com/pub/min….
Another Hidden Collection Addition

open.substack.com

Another Hidden Collection Addition

Mineral Matters #725

0
1
6
Howard Lee
@hlee.bsky.social
about 3 hours ago
Reposting this 👇 If America is going to have a future that isn't darker than the dark ages please show up for the No Kings protests tomorrow. 🧪⚒️🧬💉💸 arstechnica.com/science/2….
US science is being wrecked, and its leadership is fighting the last war

arstechnica.com

US science is being wrecked, and its leadership is fighting the last war

Facing an extreme budget, the National Academies hosted an event that ignored it.

2
14
40
Princess Vimentin PhD | Cancer Biologist
@princess-vimentin.bsky.social
about 3 hours ago
🧪Fun fact: The new ACIP has anti vaccine proponents & very likely won’t recommend vaccines to people. If ACIP doesn’t recommend vaccines, then insurance may not cover them. That potentially impacts access. This is how these policies impact everyday Americans.
1
7
12
Joe Sabol
@josephsabol.bsky.social
about 3 hours ago
🧪 #policy "[A] unique dataset for global comparative analyses on public perceptions of science and...policy-making." Mede, N.G., et al. Perceptions of science, science communication, and climate change attitudes in 68 countries – the TISP dataset. Sci Data 12, 114 (2025). doi.org/10.1038/s415...
Perceptions of science, science communication, and climate change attitudes in 68 countries – the TISP dataset - Scientific Data

doi.org

Perceptions of science, science communication, and climate change attitudes in 68 countries – the TISP dataset - Scientific Data

Scientific Data - Perceptions of science, science communication, and climate change attitudes in 68 countries – the TISP dataset

0
3
4
Dr. James H. Gundlach
@pecanjim.bsky.social
about 3 hours ago
Here are three graphs showing nine sets of relationship between sets of yearly death rates from 1979 through 2023. The nine comes from death rates for age group. 0-19, 20-64, and 65+ plotted by three measures of Evangelism. See moire under ALT. 🧪💡☠️ #Sociology #Population #Demography
This rather large set of correlations was produced to look for an explanation of an area that is poorly and rarely measured in the United States, religious composition of the United States population that can be attached to death rates. The measure of religious beliefs displayed by the red squares is only measured in 2013 and 2014. The grey dots measuring prayer are only measured around 2020, I have to look up the exact year, and the grey line of triangles is measured each census year, which only happens in the years ending in a zero. To understand how far I am stretching data just think that that grey dot at the bottom left of the graph shows the correlation between state deaths in 1979 and the percent of a states population who prayed in 2020. I don't have enough characters available. in the rest of this post to explain why I go to such extremes. But I think this has paid off.

The main reason I think this limited data are useful is he census year measures show a strong stability, they are available for years 1980, 1990, 2000, 2010 and 2020.  And  these measures for all the states for all the years yields a correlation matrix where the lowest r is 0.90 and two are 0.99.

Here the times that there are the largest differences during time periods, the prayer and Evangelical measures move together but the percent Evangelical measure seems to be the most stable.  The main thing I see here is all three measures show r's increasing from the lower 0.3's to 0.7's over this time period. The fact that the three sets of early and later correlations are so close together showing close to the same amount of change is worth remembering. Let's see how the same analysis of mortality data for age groups 20-64 and 65+ look before coming to a conclusion.
The middle age correlations  are based on many more cases than the young, 27,374,229, but the general patterns have substantial similarities.  The first difference I see is the early correlations are a little stronger here. One interesting change is the 80's gap is much smaller but shows much the same pattern. I can think of no possible explanations for this 

The main similarity I see is the general increase  in correlations over time. It raises the question:  How could the underlying kind of religion partially tapped by these three measures and earning different names, become a stronger cause of high death rates? I will suggest a possible answer below the last graph. The big thing I see are the six sets of fairly strong positive correlations for all six of the measures for the last few years. 

As a side note, Steve Stack and I won the 2004 Ig Nobel Prize for Medicine for our article on country music and suicide. One of my repeated lines in introducing social research was to use the idea that  country music contributed to suicide. The idea came from a long period of early beer joint experiences, Hell, my youngest brother took his first steps on a pool table. We were in the local beer selling pool hall when I looked over and saw him standing and taking steps on the pool table closest to the bar. I told my mother he was walking and she replied that he couldn't be. I told her to look. She did and yelled "he is", and ran to pick him up.  Any as I grew up I saw enough cases of men getting drunk and dying in a very fast car wreck  hitting very solid things that people thought it might have been suicide. They were usually labeled DUI's. As I grew up I probably spent almost as much time in beer joints as I did school. Anyway in a graduate methods class that line resulted in a student taking classes in the radio business told me he had a on radio stations by music mode, including country, in the large metros. He got it , I entered data, calculated statistics and published
Well back to religious beliefs and suicide looking at the same data for ages 65+.  The number here shows just how much the elderly dominates death rates, 79,555,164 is a very large n for studies of humans. Adding all three produces an N of 108,750,440. And the elderly graph shows some major similarities to the other two. One major similarity i s the little red squares are almost always on top. Since these are calculated from the data produced by Pew Research Center. They have probably produced more data on the more difficult research subjects and anyone else I can think of and when they measured the number of Evangelicals they found more than the other measures while staying very highly correlated with the other measures, I am inclined to believe this is the best measure of the religious group producing the high death rates. However, I am at a loss looking for an ideal label for the people with the religious beliefs that use religion for health care. 

I find the large increase in the death rates among the elderly in all three measures an additional sign that the measures fit how COVID  has hit the elderly hardest and they show the major increases after COVID vaccine became available. This is a clear sign that all three measures fit the population that refused COVID vaccinations. However, the prayer line of dots being so much lower than the other two lines suggests that people who pray. every day are not as likely to consider prayer as a source of health care as people captured by the other two measures.
1
1
10
Princess Vimentin PhD | Cancer Biologist
@princess-vimentin.bsky.social
about 3 hours ago
🧪Yes! We need this! We can’t rely on misinterpreted data to make important decisions that affect people’s lives. RFK Jr. pushes junk science. We can’t let this go on. Staying tuned for new developments. www.bmj.com/content/389/...
Independent US vaccine body is planned after RFK Jr’s mass firing of CDC advisory panel

www.bmj.com

Independent US vaccine body is planned after RFK Jr’s mass firing of CDC advisory panel

“High level” discussions are underway to establish an independent US vaccine committee following the dismissal of 17 members of the Centers for Disease Control and Prevention’s advisory committee on i...

3
17
61