1. Bluesky Feeds /
  2. Ansgar Wolsing /
  3. #30DayMapChallenge

Custom feed for the #30DayMapChallenge (posts from the last 7 days) The challenge is organized by Topi Tjukanov (@tjukanov on Twitter, 30daymapchallenge.com) The feed captures this regular expression in post, image alt, and link text - case-insensitive: 30\s?Days?\s?Maps?\s?Chall[ae]nge

Feed on Bluesky

Feeds Stats

  • 💙 Liked by 52 users
  • 📅 Updated 9 months ago
  • ⚙️ Provider skyfeed.me

#30DayMapChallenge Likes over time

Like count prediction
The feed #30DayMapChallenge has not gained any likes in the last month.

Feed Preview for #30DayMapChallenge

Ansgar Wolsing
@ansgarw.bsky.social
10 months ago
#30DayMapChallenge happening in November! 🗺️ Here are the categories. Last year, I created a Bluesky custom feed which you can follow to see all posts about the challenge: bsky.app/profile/ansg...
The categories for the #30DayMapChallenge, see link in the comments.
2
6
20
Kyle Walker
@kylewalker.bsky.social
4 days ago
From the 2024 #30DayMapChallenge: a mobile-first #rstats Shiny app that geolocates you then shows you how far you can walk in 10 minutes. Try it out: walkerke.shinyapps.io/day…. Code: github.com/walkerke/map...
Video thumbnail
Play button
0
2
23
Colpizen
@colpizen.bsky.social
10 days ago
[Vadrouillages immobiles] Archive via @lucasdestrem.bsky.social :) #30DayMapChallenge 2022 Jour 26 : Île(s). L'Île-de-France comme si c'était une île, après une étrange montée des océans. Des ports (avec quelques jeux de mots), des caps, des phares, des ferries et des parcs naturels marins....
1
8
17
Paul G.
@slackjackflack.bsky.social
about 1 month ago
Last year for the #30daymapchallenge I made a Heatmap of Satellite (VIIRS) Thermal Hotspots and Fire Activity. Just after hearing the news #Iran shows new active hotspots with the live data.
0
0
3
Kyle Walker
@kylewalker.bsky.social
3 months ago
From the 2024 #30DayMapChallenge: an interactive Dorling cartogram of net migration rates by US county in 2023. Built with @mapbox.com and R. Interact with the map: walker-data.com/map-challeng... Make it yourselves: github.com/walkerke/map...
0
2
4
Koen Van den Eeckhout
@vandeneeckhoutkoen.bsky.social
4 months ago
In 2021, I created 30 completely different maps for the #30DayMapChallenge. In a blog post, I shared all the data sets, techniques and tools I used along the way! medium.com/p/66d6377b8644 (Post 2 out of 4 while I'm on holiday, sharing some highlights from previous years)
A map of Europe showing population density using polygons of different sizes. The map is titled 'Where we live'.
0
1
8
Hans van der Kwast :qgis:
@hansakwast.fosstodon.org.ap.brid.gy
4 months ago
The new QGIS Map Gallery is looking for contributions! 🗺️ Share your #QGIS creations and showcase the power of #mapping with QGIS. I've added some of my maps from #30DayMapChallenge. Check it out: hub.qgis.org/map-gallery/ #GIS
0
2
2
Hans van der Kwast
@qwast-gis.com
4 months ago
The new QGIS Map Gallery is looking for contributions! 🗺️ Share your #QGIS creations and showcase the power of #mapping with QGIS. I've added some of my maps from #30DayMapChallenge. Check it out: hub.qgis.org/map-gallery/ #GIS #gischat
2
7
22
Kyle Walker
@kylewalker.bsky.social
5 months ago
A bonus #rstats #30DayMapChallenge how-to, thanks to some updates to the {mapgl} package: make an interactive, raster temperature map for any date and any state. Example: walker-data.com/map-... Code: github.com/walkerke/...
0
3
20
Kenneth Wong
@kennethkhw.bsky.social
5 months ago
Finally closing my 2024 #30DayMapChallenge! Wrote a blog summarising what I learned, the behind-the-scenes challenges faced, and the fun I had creating maps last Nov. Check the blog and maps out here: 🗺️🔗 mappyurbanist.com/blog/20…. #gischat
Postmortem of my #30DayMapChallenge 2024 | Kenneth Wong - Cities and Maps

mappyurbanist.com

Postmortem of my #30DayMapChallenge 2024 | Kenneth Wong - Cities and Maps

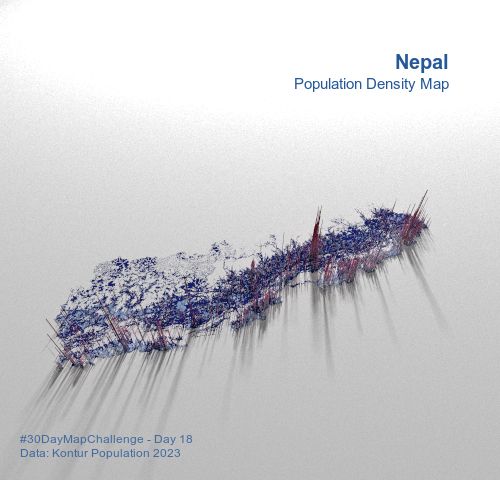
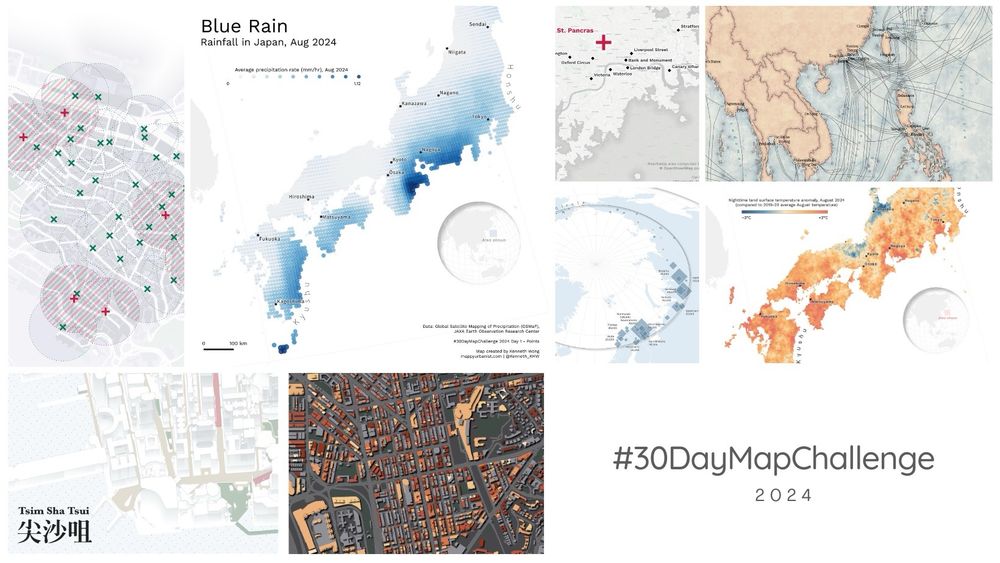
Behind the scenes of making the maps
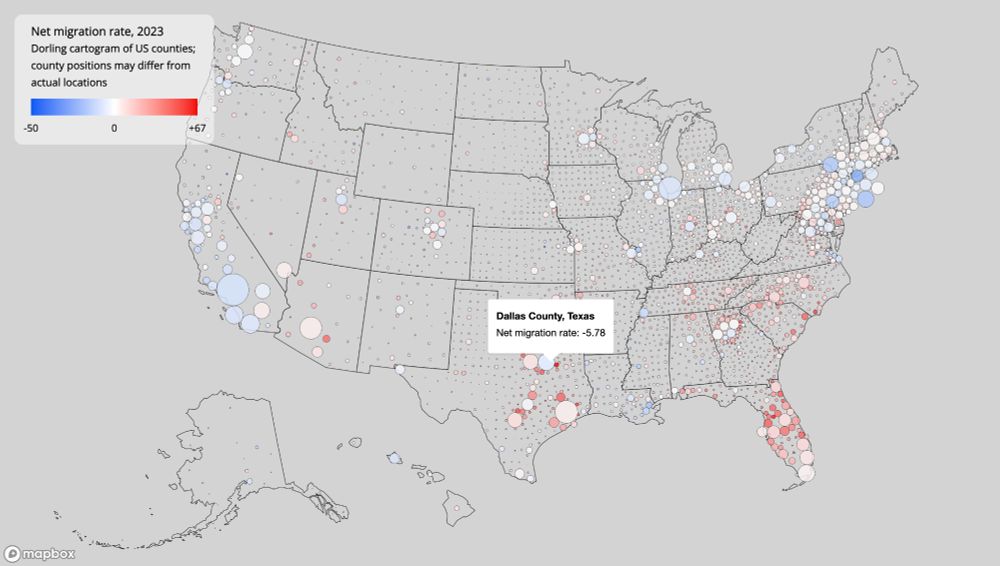
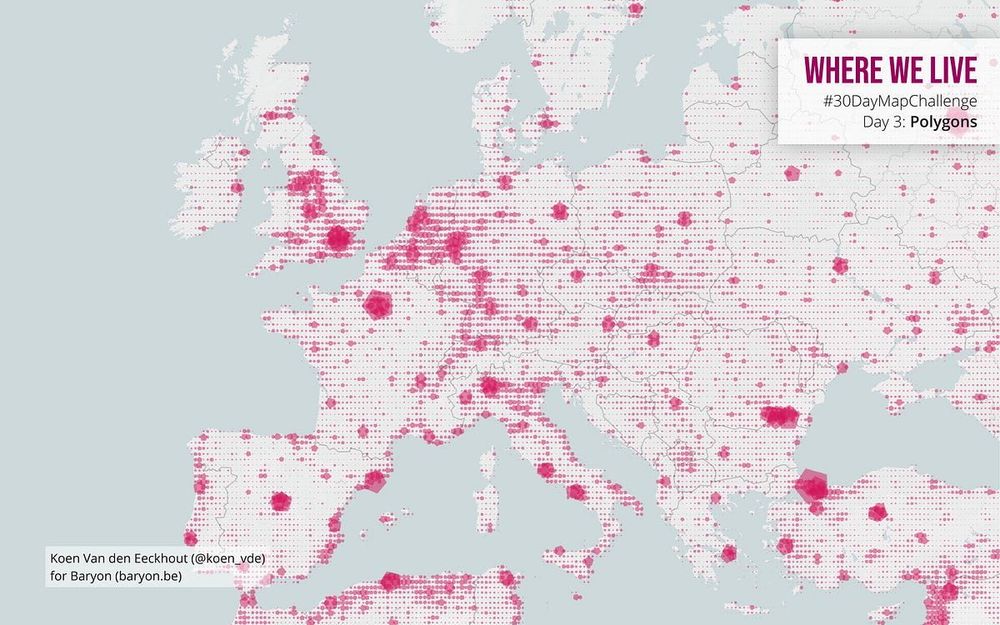
1
5
18
Tan G.
@tangandhara.bsky.social
5 months ago
#30DayMapChallenge day 30 - the final map As everyone is talking about peace and peacekeepers, here's a map of reported incidences of violence against peacekeepers during sub-Saharan Africa operations that resulted in fatalities, injuries, or kidnappings between 1989-2009. #rstats #dataviz
"Peacemakers at Risk, 1989 - 2009"
"Instances of violence against peacekeepers deployed to conflict-affected countries in sub-Saharan Africa as part of both UN and non-UN peace operations between 1989-2009"

map of sub-saharan africa with some countries highlighted in dark grey colour and while others are white. there are red dots indicating instances of violence.
1
1
9
Tan G.
@tangandhara.bsky.social
5 months ago
#30DayMapChallenge day 29 - Overture Not feeling this one but it gave me a chance to go back to where I started on this - Birmingham City FC. I used @alexsingleton.bsky.social's guide to querying the CDRC Points of Interest dataset to find all places named 'Birmingham City'. #rstats #dataviz
2
0
2
Aitor
@aitorfreire.bsky.social
5 months ago
Recupero este tweet: #30DayMapChallenge Día 30: Remix Último día y toca refrito con todos los mapas del reto, confesaré que me ha costado más crear el gif que casi cualquiera de los mapas anteriores, así que también valdría por el día 29 😅 Congrats to @tjukanov for the initiative!!
Gif con todos los mapas creados por Aitor Freire para el desafío 30DayMapChallenge
0
0
0
Tan G.
@tangandhara.bsky.social
5 months ago
#30DayMapChallenge - day 28 - the blue planet Water companies in the UK have been heavily criticised for under investing in infrastructure since privatisation because when it rains here, it poos as untreated water is released into rivers and seas. #rstats #dataviz
"The Blue Planet or the Poo Planet?"

"Using Southern Water's data of 'genuine' releases from storm overflows that are 'impacting' bathing water quality (i.e. releases that are contaminated by sewage or otherwise untreated waste water) we get an idea of how many hours of releases have occurred at bathing water sites along the south coast of England this year. 

There is great variation between sites: Felpham, Yaverland, and Sandown have each had more than 600 hours (25 days) of releases but Seaford, Middleton-on-Sea, and Birling Gap have had less than 5 hours."
2
2
4
Tan G.
@tangandhara.bsky.social
6 months ago
#30DayMapChallenge - day 27 - micromapping This is a map of Camp de Bulengo in eastern DRC. It's one of a number of camps for refugees and IDPs that the M23 rebels ordered to be emptied last week. The order is in contravention of international laws and exacerbates the crisis. #rstats #dataviz
"Camp de Bulengo - DR Congo"

"Bulengo is one of the many camps for internally displaced people west of Goma, North Kivu’s provincial capital. On February 9th the M23 rebels, who are now in control of Goma, told camp residents that they had 72 hours to leave. International humanitarian law, applicable to the armed conflict in eastern Congo, prohibits the forced displacement of civilians except for their security or for imperative military reasons."
1
6
7
Tan G.
@tangandhara.bsky.social
6 months ago
#30DayMapChallenge - day 26 - map projections This one's just for Pres. Trump (if you're not Trump pls scroll by): did you get the idea for taking over Canada and Greenland because they looked big on a map? Here's some alternative projections which might change your mind bigly! #rstats #dataviz
The Politics of Projections
Trump wants Greenland and Canada but maybe he just got the idea after looking at the wrong map projection? Do these other projections make the territories look more or less attractive?

Series of 12 map projections featuring USA, Canada and Greenland
0
1
4
Tan G.
@tangandhara.bsky.social
6 months ago
#30DayMapChallenge - day 25 - heat In the heat of battle M23 rebels (and by extension Rwandan military) have, over the past year, largely been attacking civilians and state forces in Nord-Kivu, according to @acleddata.bsky.social data. #rstats #dataviz
The plots show the main instances of political violence in eastern DR Congo that involves the Rwandan backed M23 rebels between Jan 2024 - early Feb 2025. The three main types of violence involve M23 attacks targeting either Congolese civilians; a collection of rebel groups allied with the government that are known as EPLC or Wazalendo; or the Congolese military.
3
5
10
Tan G.
@tangandhara.bsky.social
6 months ago
#30DayMapChallenge - day 23 & 24 - Memory & Only Circular Shapes A bit of cheat but here's a plot of places I've lived, using a map made of only circular shapes - two prompts for the price of one! Inspired by @ansgarw.bsky.social's plot for day 23 which is linked in this thread. #rstats #dataviz
2
1
4
Tan G.
@tangandhara.bsky.social
6 months ago
#30DayMapChallenge - day 22 - 2 colours There's around 7 million internally displaced people in DR Congo and this map shows where they're located. Rwanda, who is backing the M23 rebels in eastern DR Congo, is shown in red while density of IDPs are shown in shades of black. #rstats #dataviz
"Internally Displaced Persons in DR Congo"

"Since 2018 almost 7 million people have been internally displaced in the DR Congo, with around 4.5 million of these in people in North & South Kivu provinces which border <span style='color: #800d33 '>**Rwanda.**</span> Although the data here is only up to the end of 2024, the IOM estimated that between mid-October 2024 and mid-January 2025 approximately 658,000 people have been newly displaced in North and South Kivu. 

A key driver of this displacement has been the ongoing conflict between M23 rebels, who the UN says are under the de facto control of the Rwandan army, and the Congolese military. They have seized control of territory in North Kivu, including the capital Goma, and are currently heading towards Bukavu in South Kivu."
1
3
9
Tan G.
@tangandhara.bsky.social
6 months ago
#30DayMapChallenge - day 21 - Conflict Used UNHCR data to plot where in Africa refugees and asylum-seekers from the Democratic Republic of the Congo have sought refuge since 2017. #dataviz #rstats
Title: Refugees and asylum seekers from DRC
Subtitle: Since 2017 more than 1.1 million people have left the DRC to seek refuge and asylum in countries elsewhere in Africa
Map of africa showing where asylum seekers and refugees from DRC have sought refuge.
Table: DRC Refugees and Asylum-seekers by Country of Asylum
Subtitle: The top ten largest host countries for DRC refugees and asylum-seekers
2
2
5
Tan G.
@tangandhara.bsky.social
6 months ago
#30DayMapChallenge - day 20 - OpenStreetMap First in a series of maps about the conflict in eastern Democratic Republic of Congo, where M23 rebels, supported by the Rwandan miltary, fight the Congolese army. Plotted the national boundaries over the OSM tiles from {ggspatial}. #rstats #dataviz
First in a series of maps about the conflict in eastern Democratic Republic of Congo, where M23 rebels, supported by the Rwandan miltary, fight the Congolese army. This plot shows the location of the two countries and the disparity in their size.
1
1
3
Tan G.
@tangandhara.bsky.social
6 months ago
#30DayMapChallenge - day 19 - typography Absolutely copped out with this one but here's a hex map using {tilemaps} package of the wards of my Worthing parliamentary constituency. Its the best I could think of for this prompt. #rstats #dataviz
3
0
5
Tan G.
@tangandhara.bsky.social
6 months ago
#30DayMapChallenge - day 18 - 3D Had absolutely no idea what I was doing but I just followed a {rayshader} tutorial to plot the population density of Nepal. Absolutely amazed by that I could do this with R. #rstats #dataviz
Nepal population density map
2
6
40
Kenneth Wong
@kennethkhw.bsky.social
6 months ago
#30DayMapChallenge Day 16 - Choropleth Interactive map of median household income distribution in Hong Kong, made with #RStats Challenging myself to create a non-static and non-QGIS map, despite a late submission 🤐 #RSpatial
Video thumbnail
Play button
0
2
6