Olivier Simard-Casanova
dslc-io.github.io
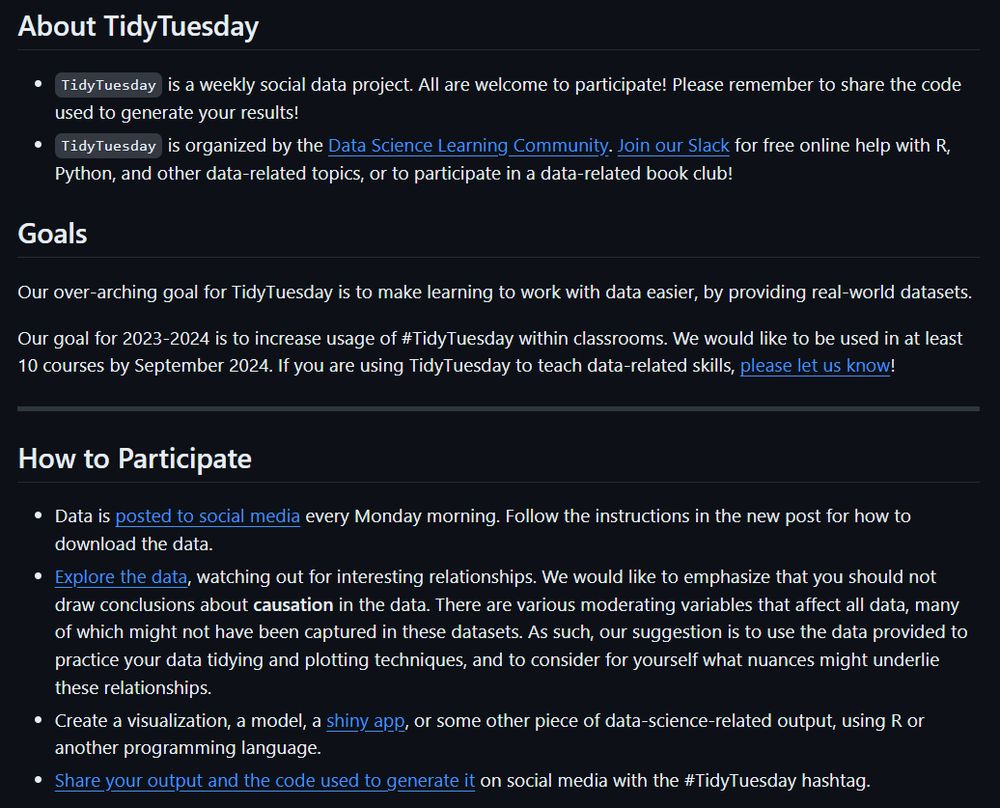
Curating a Dataset


dslc-io.github.io
Curating a Dataset


fosstodon.org
Bruno Rodrigues :rstats: :tux: (@[email protected])
reminder to cite the software packages you use for your research kthxbye https://docs.ropensci.org/rix/authors.html#citation


youtu.be
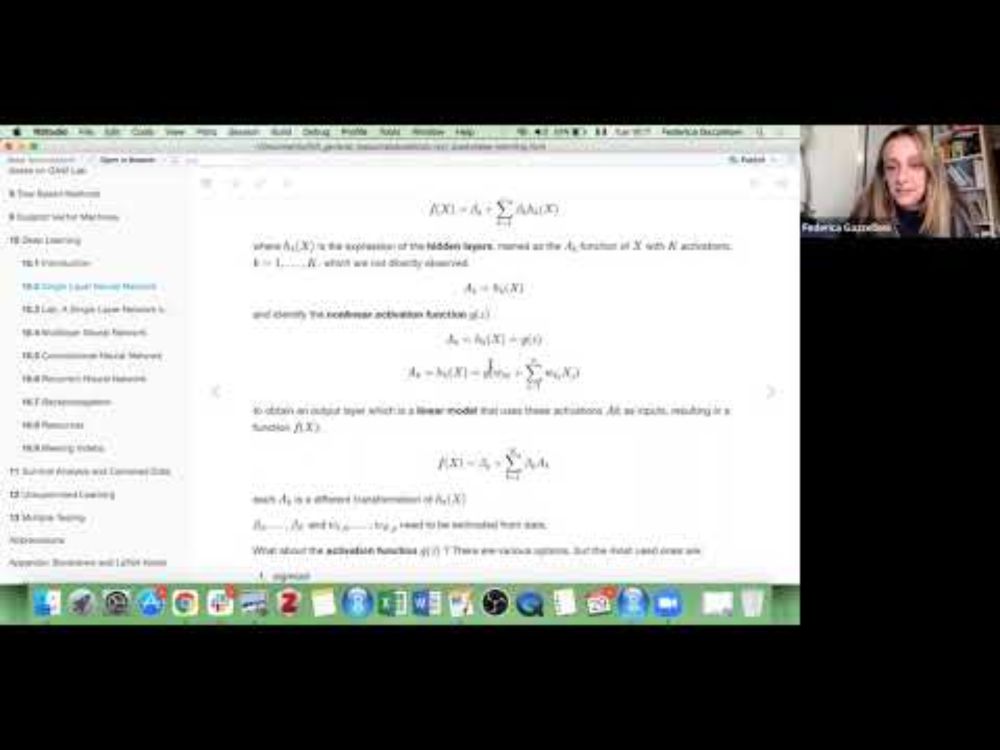
ISLR: Deep Learning (islr01 10)
YouTube video by Data Science Learning Community Videos

cran.r-project.org
CRAN: Package orbweaver
Seamlessly build and manipulate graph structures, leveraging its high-performance methods for filtering, joining, and mutating data. Ensures that mutations and changes to the graph are performed in place, streamlining your workflow for optimal productivity.

hachyderm.io
Original post on hachyderm.io


www.physalia-courses.org
Beyond Beginner R: Advancing Your Coding Skills
Dates 27-30 May 2025